The end of the regular season has come, and with it, the time to examine another season’s worth of information about how many runs teams scored and gave up. A tradition every season that has expanded over the years, this information can give us a better look at, broadly speaking, what the different teams did well or not so well, and give a bit more insight as to why the final standings ended up the way they did.
Information was gathered across the season as results came in, to tally up how many runs each team was scoring and allowing, both under player control and as an AI. The important factors are how many runs the player scores and how many runs the AI allows, but information on the AI scoring and player defense was also collected for this season. When tallying this data, only raw run count was taken into account – not the run differential. The multipler was included, with fractions resulting from it dropped (so a team that scored 17 runs in a home game was logged as scoring 20 runs). Additionally, a couple of exceptional cases were dropped from the overall totals – notes on the specifics are in the appropriate sections below.
Below, going by division, are tables showing the average per-game values for each of the four values for each team, followed by analysis and some further numbers.
Backyard Division
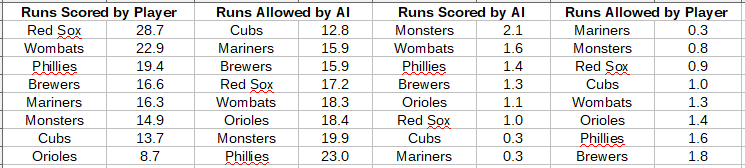
Looking at the Backyard totals, it’s immediately clear why the three teams that secured playoff spots without play-in games did so: they are at the top of their class in one of the two most important categories. The Red Sox and Wombats were able to frequently overwhelm their opponents with sheer force of runs scored, while the Cubs took the opposite approach, keeping their opponents’ totals down much better than any other team to allow them to win games without having to score a lot of runs. There was a lot of focus this season on the success of offense-oriented draft strategies, but the Cubs (and similar teams in the other two divisions) showed that prioritizing defense is still a valuable strategy as well. Among the other five teams, four are more or less jumpled together in these stats without any really sticking out, while score comparisons make it clear why the Orioles were the only team not in contention for a playoff spot.
The Red Sox’s dominance is especially clear from these numbers, as they ended the season with the most runs scored by a huge margin – a total of 81 more runs than the Wombats, while at the same time their AI defense graded out in the top half of all teams. They proved that ignoring pitchers can be a viable strategy if, like them, you make good use of that to load up on the other skills. An offense-heavy team led by one of the best coaches in the league would likely have taken the Sox to the playoffs on its own, and their defense was also strong enough to do a solid job of making up for the lack of pitching depth, preventing it from being a critical Achilles’ heel. More numbers to demonstrate their dominance: the Sox’s lowest score in the entire season was 12 runs, higher than the top scores of four other teams in the league this season. They only scored less than 20 runs four times during the season, and at the same time only gave up more than 20 runs five times. It’s a wonder they only took the first seed by a single game, but then two of their losses came by margins of 1 and 2 runs – only their opening week loss to the Monsters saw them perform significantly worse than their rivals. Overall, the Sox outscored their opponents by 11.5 runs on average, truly a ridiculous count, making it clear why they deserved the first seed and are the team to beat heading into the playoffs. Aesnop has done it again.
The Wombats are comparatively lost in the shuffle thanks to having to be compared with Aesnop. Aside from the Red Sox, though, the Wombats were the top-scoring team in the division by a healthy margin, as might be expected from Wizard’s offense-heavy draft strategy. More surprising is how their AI defense held up; this was expected to be a massive weakness for them, and most people before the season would have predicted them to give up the most runs by a good amount. Yet they actually graded out as average in this regard, fifth-best in the division and with only the Cubs doing significantly better in this regard – all other teams were within 35 runs allowed of the Wombats (except the Phillies, who did significantly worse). In fact, if you take out the high score against them, a 52 by the Red Sox, their average jumps all the way up to second place in the division! Anecdotes during the season pointed to Star Moonbeam as a significant factor in this, as her speed at first base proved an effective counter to grounder-heavy strategies. Whatever the specific reasons, the AI Wombats were able to hold out decently, even contributing some to the player effort with the second-highest AI run total of the division, and that allowed their strength in offense to make the difference. The Wombats outscored their opponents by an average of 4.6 runs, pathetic compared to the Red Sox but strong compared to everybody else, and that’s a clear reason why they secured a playoff spot without much trouble.
On the other side of the coin, it’s a bit surprising that the Cubs secured the second seed if you just look at their run total, the second-lowest in an overall very high-scoring division. This clearly was an overall weakness, as their AI counterparts only scored 4 runs across the entire season (3 of those runs coming in a single game, making the difference in a tight contest with the Brewers, leaving just 1 run across the other 13 games). But they made up for it by having an AI defense far better than any other in the division, keeping their opposition’s score low and thus giving themselves a good chance at success. In a division where the higher-scoring teams would regularly put up 20 or more runs, the Cubs only reached that mark once during the season… but they also only gave up that many runs once. Their outfield was a source of concern in the preseason, but once the season itself began, those fears proved to be unfounded, and instead it proved just as strong as the infield. For those wondering if a defensive meta is still viable, look no further than the Cubs, whose defensive dominance gave them the second seed almost entirely on its own.
Of the three teams who tied for fourth place, the Monsters are probably the most surprising. They’re among the bottom teams in the division in terms of both runs scored and runs allowed; especially in as hotly contested of a division as the Backyard, one would expect this to result in a poor record, and in fact on average they were outscored by 5 runs per game. Looking at game-by-game totals, it becomes clear what was going on: the Monsters were a very inconsistent team. They were able to put up a few very strong scores, which resulted in victories, but more of the time, they were putting up middling or poor scores, and their subpar defense resulted in most of those turning into losses. When the Monsters were good, they were great, but they weren’t good more often than not. However, they did get some help from their AI offense – leaving aside thrown games, no AI team scored more runs this season than the Monsters, who racked up 30 across the season, averaging over two per game and only getting shut out twice. Most of the time this didn’t matter in the grand scheme of things, but in two of the Monsters’ wins, their AI’s contributions on offense did indeed make the difference – without this boon, they would’ve been 4-10. It’s interesting that their position in the play-in series for the fourth playoff spot was in no small part due to the AI offense that so rarely matters in these games.
The Mariners were essentially a lite version of the Cubs this season. They had a somewhat better player offense than the Cubs while still being in the bottom half of those rankings, and a somewhat worse AI defense while still tying for second-best in that regard. However, the shift in defensive strength was slightly larger than the shift in offensive strength: the Mariners did score more runs than their AI let up this season, but only by the narrowest of margins (6 runs total), outscoring their opponents by 0.4 runs on average compared to 0.9 for the Cubs. They also suffered from a lot of very close losses – 6 of their 8 losses this season saw them less than 5 runs behind their opposition. They would often come close to getting it done, but not quite close enough, preventing them from claiming a playoff spot outright and relegating them to play-in games. They weren’t helped at all in this regard by having one of the worst AI offenses in the league; at just 4 runs, their AI tied with the Cubs for the least runs scored across the season and so couldn’t help them at all in close contests. At least on the flip side, they had one of the best player defenses in the league: led by likely Ace Wilson pitcher Brad Radke, the Mariners gave up just four runs across the entire season, tied for the lowest total in the league. On the whole, despite being the only team in the play-in series to outscore their opponents on average, the Mariners just couldn’t get it done quite well enough.
The final team tied for fourth place, the Phillies, stand out by virtue of having this season’s worst AI defense. Over the course of the season, they gave up 44 runs more than the next closest team, and that resulted in them being outscored by over 3 runs on average, losing more games than they won despite having the third-highest run total in the league. Several factors contributed to this, including an offense-friendly home park and an overall very slow crew of fielders, but another big, unanticipated weakness was their AI’s propensity to bring catcher Esmeralda Heimann as their first relief pitcher, sending Lindsy Felgate behind the plate and ruining their entire defensive setup. The Phillies were a force to be reckoned with on offense, with a season low score of 13 runs and totals of 20 runs or more in eight of their games, but their defense made it easy to reckon with them, as their opponents also scored 20 runs or more in eight of their games and they only held the other team to less than ten runs once. Three of the seven other teams got their highest scores of the season off the Phillies’ defense, and this overall weakness explains why they only barely made the play-in series despite their strength at the plate.
The Brewers missed out on the play-in series by a single game, going 5-9 overall, and at first glance this seems confusing – their offense was in the top half of teams this season, and their AI defense was tied for the second best. Surely with numbers like these, they wouldn’t be one of the two teams left entirely out of playoff contention at the end of the season? Yet they were, for reasons that aren’t terribly easy to understand. One factor helping is the outlier status of a single game they played, where they outscored the Orioles 38 to 3. Across the entire season, the Brewers outscored their opponents by 0.7 runs on average, but in the thirteen games other than this one, that drops to them being outscored by an average of 1.8 runs! Still, even without that game, they’d have the fourth best defense and fifth best offense in the league, so it doesn’t explain things on its own. One factor that haunted the Brewers this season was their player defense, which gave up a total of 25 runs across the season – the second-highest total in the entire league! Opposing AIs scored nearly 2 runs per game on average against the Brewers, and indeed they lost four games this season that would have been wins had they shut out their AI opponents! That alone flipped their record and made the difference between a guaranteed playoff spot and elimination, and it also highlights perhaps the best explanation for their mismatch between record and run totals: the fact that they were in a lot of very close matches this season. A full half of the Brewers’ games this season were decided by 2 runs or less, and five of those seven games were losses for the Brewers – that’s more than half of their losses all season!. They frequently fell just short of getting the job done, and a mere nine runs applied to the right games would’ve made them a 10-4 team this season. Thus it was a bit of a rough break for the Brewers, left out in the cold despite many considering them to be a playoff-worthy team.
Finally, the Orioles were the runt of the division, the only team not at least contending for a playoff spot at the end of the season, and it’s not hard to tell why: they had the worst-performing offense of the division by a country mile. On average, they scored a full five less runs per game than the next-closest Cubs, which translates to a full 70 runs less over the course of the season. No other team in the Backyard was outscored by more than three out-of-division teams this season, but the Orioles finish below 9 of the 16 other teams this season. They had massive trouble with run production this season compared to the rest of the division, and that would have sunk them even before factoring in their bottom-three AI defense. Even in the two less important categories, they were in the bottom half of the division! The Orioles were further very top-heavy in their performances: they only had four games where they scored over ten runs, and those games contributed more than half of their total runs across the season. Discounting their top four performances, the Orioles averaged less than 6 runs per game in a division where even the lowest-scoring other teams were scoring in the mid-teens or higher most of the time, and then to add insult to injury, they were outscored in two of those four performances. This simply was not the Orioles’ season, and they’ll have to hope to bounce back next season.
Run Production: The Backyard vs. Everybody Else
Last season, when the decision was made to split teams based on coach veterancy/skill, it was borne out by the fact that the Backyard league scored far more runs than their Frontyard counterparts, with only a couple of the latter able to keep pace. That continued to be the case this season, as the Backyard continued their dominance in scoring, with an average total of 17.7 runs per game compared to 11 for the Indoor and 9.4 for the Frontyard.
Only three teams from the other divisions were able to keep pace with the majority of the Backyard teams this season: the Diamondbacks, Angels, and Dodgers, all of whom put forth average run totals good enough for them to place fourth in the Backyard, while still clocking in below the Red Sox, Wombats, and Phillies. Aside from the struggling Orioles, every Backyard team scored more runs this season than each and every other Indoor or Frontyard team. That also resulted in the Backyard teams’ defenses looking comparatively much worse than the other divisions’: aside from the Cubs, every Backyard defense gave up more runs than any team from the Indoor or Frontyard, period. Even the Cubs defense struggled to compare to the other divisions, finishing ahead of just four of the eight Indoor defenses and grading out as worse than each and every Frontyard defense based on raw runs scored. This demonstrates not a lack of drafting for defense in the Backyard (which, among other things, had a much stronger lineup of catchers than the other two divisions), but simply the power of veterancy that its coaches brought, allowing them to lap the field in scoring. If you’re looking for an argument to continue separating the divisions based on coach veterancy and skill, this is perhaps the best one you can draw on.
Meanwhile, it is interesting to note that there were no significant differences in how much the AI teams scored in the three divisions. The Indoor teams tended to give up slightly fewer runs to the AI and the Frontyard slightly more, but on the whole all three divisions gave up about the same amount, with similar spreads of values among individual teams. This indicates that, while some are able to mostly avoid it, for the most part AI teams can squeeze in a run or two against just about anybody, regardless of skill level. As long as you’re not letting up an exceptionally high number of AI runs, you don’t need to worry about the fact that you’re letting some slip by.
Indoor Division
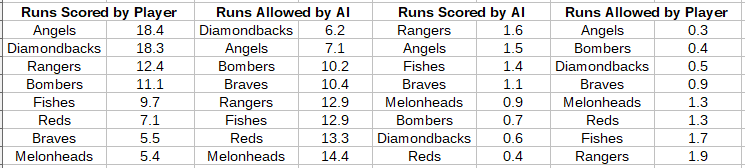
Note: The Fishes’ AI totals and the Angels’ player totals both discount one game that was thrown by the player Angels, where they deliberately failed to score and allowed the AI Fishes to score over 20 runs.
Looking at these numbers tells a clear tale of three tiers: one pair of teams that dominated the division, another that was a step below but stronger than the rest of the field, and a cluster of less effective and less relevant teams. This ended up being what we saw in the results as well, with just one difference: one of the dominators and one of the “step below” teams swapped places!
The Diamondbacks were the clear top dogs of the division, both scoring the most runs all season and allowing the least as AIs, thus befitting their 13-1 record. The Angels were their only competitors in either of these categories – aside from them, the D’Backs outscored their closest rivals by 83 runs and allowed 56 less runs! On average they outscored their rivals by a truly ridiculous 12.1 runs. Jay Green carried the team to a dominant performance that wasn’t expected and, if their AI offense is any indication, was primarily fueled by their coach instead of the players themselves. The D’Backs only scored less than ten runs twice, both in the opening four games of the season, and broke 20 runs in seven of their last nine games. Their defensive strength was more expected but still remarkable; they were the only team in the division to never give up 20 runs or more, only surrendered more than 10 runs twice, and held their opponents to 5 runs or less in a truly amazing nine out of fourteen games. This resulted in them being the second-best AI defense league-wide in terms of runs allowed, and confirmed preseason impressions of this being a primary strength for them. This likely would have secured them a playoff spot on their own; coupled with their prodigious run total, it made them almost completely unstoppable.
As mentioned, the Angels were the only team who could compete with the Diamondbacks in the raw numbers this season, outscoring their opponents by 11.3 runs on average. Due to the thrown game, their average score actually slightly edges out the Diamondbacks’ even though they scored 17 less runs during the season, and their AI defense also graded out in a competitive second place with an even 100 runs given up this season, well ahead of the rest of the division. They even were strong in the less important categories, coming in second in AI runs scored and tying for the least AI runs allowed during the season, with only four outside of the thrown game, leading to them being the only team in the league to be in the top two in their division in all four categories! Based on the raw numbers, then, it’s baffling that the Angels would finish the season with a mere 9-5 record and no spot in the playoffs – but those familiar with how their season went will understand much more easily. Put simply, the Angels were a very high-variance team. When they were good, they were very good – they scored over 25 runs in five separate games, a feat which the other Indoor and Frontyard teams combined to do only seven times across the season, and they had three games of 30+ runs, compared to just two for the rest of the Indoor and Frontyard combined! On the other hand, when they weren’t on their game, they didn’t do very well. Discounting the throw, they had four games where they scored less than ten runs, including three scores less than five, and they lost all of those games. The high variance gave them some very big wins, but also several more losses than a more consistent performance would have yielded. The final piece in them missing the playoffs was the game that they threw, providing the fifth loss and a critical one that ruled out a play-in game with the Rangers for the second Indoor seed. It’s rather ironic, considering that the throw was in protest of the limited number of playoff slots available; in any case, the Angels this season were the top team when they were on their game, but were off their game enough to have a merely “good” record in the end.
Meanwhile, based on the scoring data, the actual second-seed team, the Rangers, are clearly a step below the top dogs, if still a step above the bottom-feeders of the division. The third-best offense and fifth-best defense in the league certainly isn’t bad, but it’s not what one would expect from a team that won ten straight games to begin the season – indeed, the Rangers were actually barely outscored by their opponents across the entire season! (A margin of 7 runs, or half a run per game.) However, this makes more sense when accounting for the massive fall from grace they suffered in the last four weeks of the season – during the first ten games, they averaged 13.9 runs scored and just 9.1 allowed, a clear third-best in the division, while during their four-game losing streak, they averaged just 8.5 runs scored and a whopping 22.3 runs allowed per game! The three highest scores against their AI all came in the last three weeks of the season, which doesn’t bode well for their playoff chances. So the Rangers were clearly a level better before this disastrous end-of-season skid, but the numbers themselves still don’t make it clear why they edged out the still much more impressive Angels. Ultimately, this comes down to the Angels’ inconsistent performances, combined with some narrow wins by the Rangers. Four of their ten wins came on margins of two runs or less, compared to just one of their four losses. The Rangers were a step above most of their division in any case, and these good breaks made the difference to give them a superb start to the season and a playoff spot. It’s also interesting to note that the Rangers both had the most AI runs scored and allowed the most AI runs, although this doesn’t seem to have affected the season much – they won one game thanks to their AI scoring enough runs, and lost one thanks to giving up to many AI runs, so it all balances out in the end.
The other higher-tier team from this division was the Bombers, whose fourth-place position in runs scored and third-place position in runs allowed puts them clearly ahead of the lower four teams in the division. Still, they had an inconsistent season, undoubtedly not helped by the midseason change in coaches. They had three games where they scored 20 or more runs, but then scored 13 or less in the other eleven games of the season, perhaps inflating their numbers somewhat. Similarly to the Rangers, they also benefited from being on the right end of several close matchups, winning four games by margins of 2 or less (including the last three of the season!) while losing only one such game. Nevertheless, the numbers are clear: they scored significantly more runs than the bottom four teams, gave up significantly less than any of them except the Braves, finished three games ahead of the fifth-place team, and were the only team outside of the two juggernauts to outscore their opponents on average (by a narrow 0.9 runs on average). Perhaps they had some good breaks along the way, but in the end their performance was clearly one of the better ones, all the more impressive considering that it was achieved by two different coaches.
The four other teams in the division were all clearly below the top four teams to varying degrees. Of these teams, the Fishes had the best record, which can be easily explained by the fact that they scored the most runs, over 30 more than any of the other bottom four teams across the season. Their runs allowed number isn’t great (three allowed scores of 20+ runs is the third-worst such number in the division) and probably looks better than it should owing to the Angels’ thrown game, but it was decently competitive with this group, so their better run production translated to a few more wins that deservingly put them at the top of the group – four of their six wins came from four of the six games where they scored 10 runs or more. On the other hand, they were definitely worse than the top teams in both categories, on average getting outscored by 3.2 runs per game, so their lack of playoff contention is hardly a surprise. Similarly to the Rangers, they both scored a relatively high number of runs as an AI and let up a relatively high number of AI runs, though again this ultimately didn’t have a great overall impact on their performance.
The Braves, on the other hand, had a much better performance on defense than the other teams in this tier. Their four-place ranking in AI runs allowed makes them the only team to rank up with the upper tiers of teams in either of the two important categories. They were also more consistent than the third-place Bombers, only giving up 10 runs or more five times across the season compared to 7 for Baltimore, and a pair of very high scores at the end of the season threw them off significantly in this category; without the 53 combined runs from those two games, they would’ve been well ahead of the Bombers and close behind the leaders. Unfortunately, while the Braves did well in defense, they struggled to produce many runs of their own, only recording two more across the season than the last-place Melonheads. Their cap of 17 is the second-lowest such cap in the division, and without three stronger 10+ run performances, they would have averaged a dismal 3.3 runs per game. Ultimately, this poor run production resulted in them too often being able to put quite enough runs on the board to capitalize on their defensive strength, resulting in their poor record as they were outscored by 4.9 runs on average. The Braves were also on the wrong side of a lot of close games this season, losing 5 games by close margins of 3 runs or less compared to getting just one such win. Overall, the Braves were an average team for their division in most respects, but dragged down by their troubles scoring.
The Reds avoided the cellar of the division by virtue of doing slightly better at scoring than a couple of other teams. They only scored 10+ runs three times across the season, but they usually scored in the 6-9 run range, as opposed to the Braves and Melonheads which frequently clocked in 1-5 runs, and that slightly better performance allowed them to take a couple of close games when their opponents couldn’t perform up to snuff, in addition to one strong win when they logged a season-high score of 18 runs. On the other hand, they had one of the worst defenses in the division, just 16 runs away from the last-place position, so it’s no surprise that they were jockeying for the cellar position this season. They only gave up 5 runs or less once all season – each other team in the division accomplished this at least twice – and the overall high scores that they allowed prevented them from being close to victory very often at all. Only two of their eleven losses were decided by less than five runs, indicating that minor improvements (like their AI offense actually contributing instead of scoring in just two games all season) would have barely helped them at all this season. In the end they were outscored by an average of 6.2 runs per game this season, making it clear why they struggled to win many games.
However, as rough as they may have had it this season, the Melonheads had it even worse. They took last place in the division this season, and the numbers bore that out as they both scored less runs under human control and gave up more runs as an AI defense than any other team in the division. With a dismal cap of 11 runs and only three games scoring over 6, they struggled to score in almost every single game this season, simply failing to get it done. Their situation wasn’t quite so bad on defense, where their numbers are skewed somewhat by the Angels scoring 75 runs off of them in two games, while nobody else in the division reached as high as 20 – but even without those two games in consideration, they had one of the worst defenses in the division, letting up totals in the teens or higher in the majority of their games. Amazingly, despite their overall weakness, the Melonheads came very close to ending this season with a decent 6-8 record, as four of their losses came on games where they could have flipped the result by scoring a single run – including three games that they lost due to home-team tiebreaker! However, when the ‘Heads weren’t losing by narrow margins or winning games, they were getting blown away. In the other 8 losses of the season, they were outscored by an average of 16.7 runs per game, giving up 10+ runs in all but one of those games and only coming within 10 runs of their opposition in two of them. Thus, while they could be competitive in the right matchups, for the most part their abysmal offense and fragile defense combined to leave them without hope of victory in this season, and they finished at the bottom of their league/division for the second season in a row.
Frontyard Division
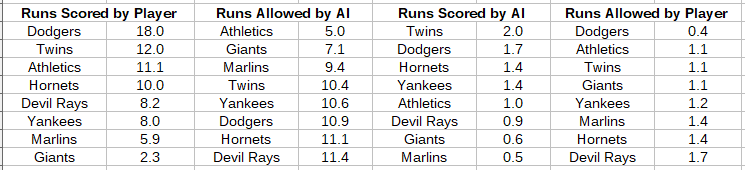
Note: The Dodgers’ player totals reflect Weeks 1 and 2 performances by current coach hitace, not the originally reported and later invalidated numbers. (hitace inherited a Week One forfeit, but still played that game, and his numbers from this were used.) Additionally, the Marlins’ player totals discount one game where they were guest-coached by Aesnop, resulting in uncharacteristically high numbers.
The Frontyard numbers clearly explain how their two playoff teams got to their positions, as each one put forth an exemplary, best-in-division performance in one of the two key categories. Beyond that, it’s largely a big jumble with the rest of the teams. The relatively balanced nature of this division compared to the Indoor is reflected in the fact that six of the eight teams finished in the top half in one of the two categories, and it’s the only division where no team finished in the bottom three of both categories.
The Dodgers came extremely close to taking the #1 seed for the division, only missing out because of a Week One forfeit inherited by their current coach, and that’s quite obviously because they far outclassed the rest of the field in terms of player performance. They scored a total of 252 runs across the season – a whopping eighty-four runs more than the closest competitor! (It is true that their average here is slightly inflated by a single monster game where they scored 49 runs, but even with that result discounted, they finished well ahead of the rest of the field.) They were the only team in the division to put up numbers that could compete with the majority of the Backyard division, and would have finished in the top half there as well. They only scored 10 runs or less three times in the entire season (although interestingly enough, they won two of those three games anyway), and broke 20 runs six times – by comparison, the rest of the Indoor combined reached that mark only four times in the entire season! Numbers like this allowed them to run away with the competition despite being stuck with a mediocre AI defense that allowed only 17 runs less than the worst in the division (and that with one game discounted). The Dodgers gave up relatively high scores of 10 or more as often as most of the division, and this was an issue for them, as all three of their non-forfeit losses came from among these games, but at other times, they’d score more runs anyway, and any opponent that failed to hit double digits against the Dodgers was left without a chance. Overall, the Dodgers weren’t quite as dominant as the top teams from the Backyard and Indoor divisions, with an average margin of victory of only 7.1 runs (compared to 11.5 or 12.1), but their sheer power on offense allowed them to easily be one of the division’s top teams anyway. It’s also worth noting that they far outclassed their division in terms of player defense, only giving up 5 AI runs all season in a division where all other teams allowed at least 15.
On the other side of the coin, the first-seed Athletics were the best overall-performing team in the division, with top-three values in both key categories, but the big focus for this team was their amazing defense, which ultimately grades out as the best in the league this season, allowing a mere 70 runs over 14 games. They only allowed 5 or more runs in five different games this season, and only gave up double digits once – without that single 21-run performance by the Dodgers, their average drops to just 3.8 runs per game! Such an exemplary defensive performance would have allowed the A’s to prosper even with a weak effort on offense, but instead they paired it with a strong performance at the plate that scored double digits in the majority of games and extended their average margin of victory to a healthy 6.1 runs. They only won by 3 runs or less once, and even their worst loss only saw them losing by 4. With only three 15+ run games and their cap of 21 runs being the only time all season that they hit 20, they weren’t the most dominant offense in the league, but when paired with their defense it was still far more than enough to get the job done, as the A’s were one of only three teams whose total runs scored was more than double their total runs allowed. On the whole, then, despite their preseason struggles, it ended up being no surprise that they took a spot in the playoffs.
Narrowly missing out on such a spot were the Minnesota Twins, who tied for second place in the division, only to then lose to the Dodgers in a tiebreaker. Like the Athletics, the Twins put up a strong overall performance, finishing in the top half in all four categories, but it was a step below the A’s, and not quite enough to secure the playoff spot. They finished the season with the second-highest run total in the division, and were the only non-playoff team in the Frontyard to score in double digits in the majority of games. That fact alone helped them to a strong record, and indeed all but one of their losses came from the 5 games where they put up single digit-scores. On the other hand, they weren’t the most dominant offense – like the Athletics, they only scored 15 runs or more in three games and only hit double digits once, and compared to the entire league this season, they finished in position 12 of 24 in terms of runs scored. On defense, the Twins sometimes were strong, giving up 6 runs or less in half their games, but at other times didn’t look so great, with six double-digit scores let up. Indeed, all four of the Twins’ losses came in the five games where they gave up the most runs as AIs. It wasn’t frequent to see a strong performance on offense make up for a weak one or defense or vice versa for the Twins – usually, both would be in or out of sync at the same time, and the Twins would win or lose accordingly, almost always by a high margin. (Only two Twins games this season were decided by less than five runs, both of them four-run wins.) This boom-or-bust nature of the Twins is reflected in their much lower average margin of victory compared to the other top teams in the division, as they outscored their opponents by a mere 1.6 runs on average. Still, the Twins were an above-average team for this division, clearly more associated with the top dogs than with the rest of the crowd, and these numbers make it seem appropriate for them to only narrowly miss out on a playoff spot. It’s also worth noting that they scored the most AI runs of any Frontyard team, although this only made the difference in a single game this season.
After the top three teams, there’s a noticeable drop off in the Frontyard’s performance. None of the other five teams finished with winning records, and all were outscored by their opponents on average. Looking at the numbers, one might expect the Devil Rays and Yankees to be near the bottom of the heap, since neither one finished in the top half in either major category – but that’s not the case, as they actually finished at the top of the heap, both finishing the season with 7-7 records! In the case of the Devil Rays, this disparity can be easily explained by a single game – a 49-8 blowout against the Dodgers at Steele Stadium where their defense got mercilessly slaughtered. Outside of that sole exception, the Rays’ defense averages out as the third-best in the division, with a high score allowed of 16 and giving up single-digit runs in the majority of their games. Coupled with a middle-class offense that scored in the upper single digits or higher most of the time, the Rays were able to perform decently. With the Dodgers blowout discounted, they were outscored by a mere 3 runs on the season, or 0.3 on average, and have the record (7-6 with one of those wins a forfeit) to match. They weren’t in any way dominant, but their performance was serviceable and about average for the Frontyard. They did allow more runs to the AI than any other Frontyard team, but this never swayed the result of a game, and most of the Devil Rays’ games weren’t very close.
The Yankees don’t have the same massive outlier skewing their stats. Instead, their numbers genuinely are weaker to the point where they’re in the bottom half legitimately in both important categories. They only scored in the double digits in four games with a cap of 14 runs, compared to giving up double digits as an AI defense seven times with a cap of 25, and on the whole their mediocre offense in particular left them struggling in the numbers and outscored by an average of 2.6 runs despite their break-even record. How’d they get such a good record then? It turns out that even moreso than the Twins, the Yankees managed to coordinate their good performances on offense and AI defense, scoring well when it counted and not bothering when it didn’t. They needed their defense to come through – six of their seven wins came when they held their opponent to single digits – but when it did, their offense was right behind it, with five of their seven highest scores logged within those seven single-digit defensive days. The only exceptions were a lone game where they outscored a double-digit score, 13 runs to 11, and one 9-run game where they lost in a blowout. This coordination led to the Yankees doing better this season than one would expect from their numbers, the disparity coming from the fact that they tended to lose by more than they won by. Five of their seven losses were by margins of ten runs or more, with their closest loss still a five-run affair, while by contrast they only won one game by more than ten runs and took three by less than five. On the whole, then, the Yankees were a relatively weaker team that benefited from some good coordination of player and AI performances.
Each of the bottom three teams in the division had a notable weakness that gave them trouble and led to their worse records. The Hornets’ weak point was their defense, as their lack of speed on the field resulted in them giving up relatively high scores with the greatest frequency. All but two of their games saw their opponents score 7 runs or more, including six double-digit scores. The Hornets didn’t suffer any blowouts as huge as those felt by teams like the Twins, Dodgers, and Devil Rays, but with their opponents reliably scoring near or in the double digits, they still had an uphill climb to win their games. Victory was almost always precluded if the Hornets scored in the single digits, and even when they did get higher scores, they were still frequently overshadowed – three of their five double-digit scores saw them lose the game anyway. This issue resulted in the Hornets having a difficult season indeed, and largely overshadowed the fact that they had one of the better offenses in the Frontyard. They usually scored at least in the higher end of the single digits, only scoring five runs or less three times, and several bigger scores, including a season high of 25 runs that was the third-best high score in the division, brought their average up to an even ten runs per game – a better value than any of the other Frontyard teams not competing for a playoff spot. That also meant that, despite their rough record and not actually being in very many close games, the Hornets were only outscored by 1.1 runs on average, again better than any other Frontyard teams outside the big three. All this suggests that the Hornets were an overall solid team whose defense was just a little bit too weak – a slightly stronger defense and they could have been firmly established as a top-half team in the Frontyard.
The other two teams had the opposite problem, with better defenses but weak offenses. The Marlins are a surprising team to see in the top half of the standings for AI defense, as they only gave up less than 7 runs three times and their mark of eight double-digit scores is the highest in the division, but while they gave up double-digit scores frequently, they were always at the bottom end of the double-digit scales. Their season high of 17 runs allowed is the second-lowest high in the division, and they gave up less than 15 runs in every game apart from that one. However, they also had trouble putting up many runs themselves, a single 11-run game being their only double-digit score aside from Aesnop’s guest-coaching stint. During the first half of the season, they tended more towards the upper single-digits, with only a single score below 7, but they fell off in production in the second half, scoring less than 5 runs in five of the last seven games. Overall, the Marlins were another team that needed their defense to deliver in order to have a shot at victory. They were able to capitalize when this did happen, winning five out of the six games where their opponents scored in the single digits, but when it didn’t, they were locked out – their only victory over a double-digit score was when they were being guest-coached. Overall the Marlins struggled a lot this season; they were outscored by an average of 2.9 runs in their thirteen regular games, the third-worst margin in the division (and second-worst if the Dodgers’ 49 against the Devil Rays is discounted), but managed to nearly break even thanks to a series of close wins when their defense delivered – all of their normal wins were by margins of 3 runs or less.
As for the Giants, they quietly had one of the best defenses in the league, tying with the Angels at exactly 100 runs given up by their AI over the course of the season, outdone by only the Athletics and Diamondbacks. Their high runs-allowed of 13 was the best in the entire league, and almost half their games saw their opponents scoring only five runs or less. Their user defense performed in the top half of the division as well. However, they struggled more than any other team this season with offense. Not much needs to be said here – they never scored in the double digits and had a high score of 7 runs, and going into more detail would just be rubbing salt in the wound. The Giants were clearly a team built for defense as well, as their AI offense was only able to score eight runs across the entire season, the fifth-worst such mark across the league. Their strong defense came at the expense of good tools for offense, and they struggled all season to make up for this.
Overall, the scoring data this season correlates pretty well to teams’ actual performances and explains how certain teams got ahead or behind. For the most part, the playoff field matches what one would expect from this data; the Brewers and Angels are probably the most surprising teams to not make the playoffs, but neither of these cases are egregious, and the Rangers are the only true surprise to see in the postseason. Thanks for reading along with this analysis!
